VWAP: the main future's average price of the day
VWAP stands for volume-weighted average price: the average price of everything traded so far today, where prices at which much was traded count more than prices at which little was traded. Basics draws the VWAP of the main future — for example ES, YM or FDAX — as one line that moves through the day. Because volume is concentrated in the main future, that is the VWAP the market watches; Basics shows the same line on mini, micro and nano futures, and converts it to the right price on CFD charts and charts of the official index. This page explains what the line shows, why traders watch it and how to adjust it.
On this page
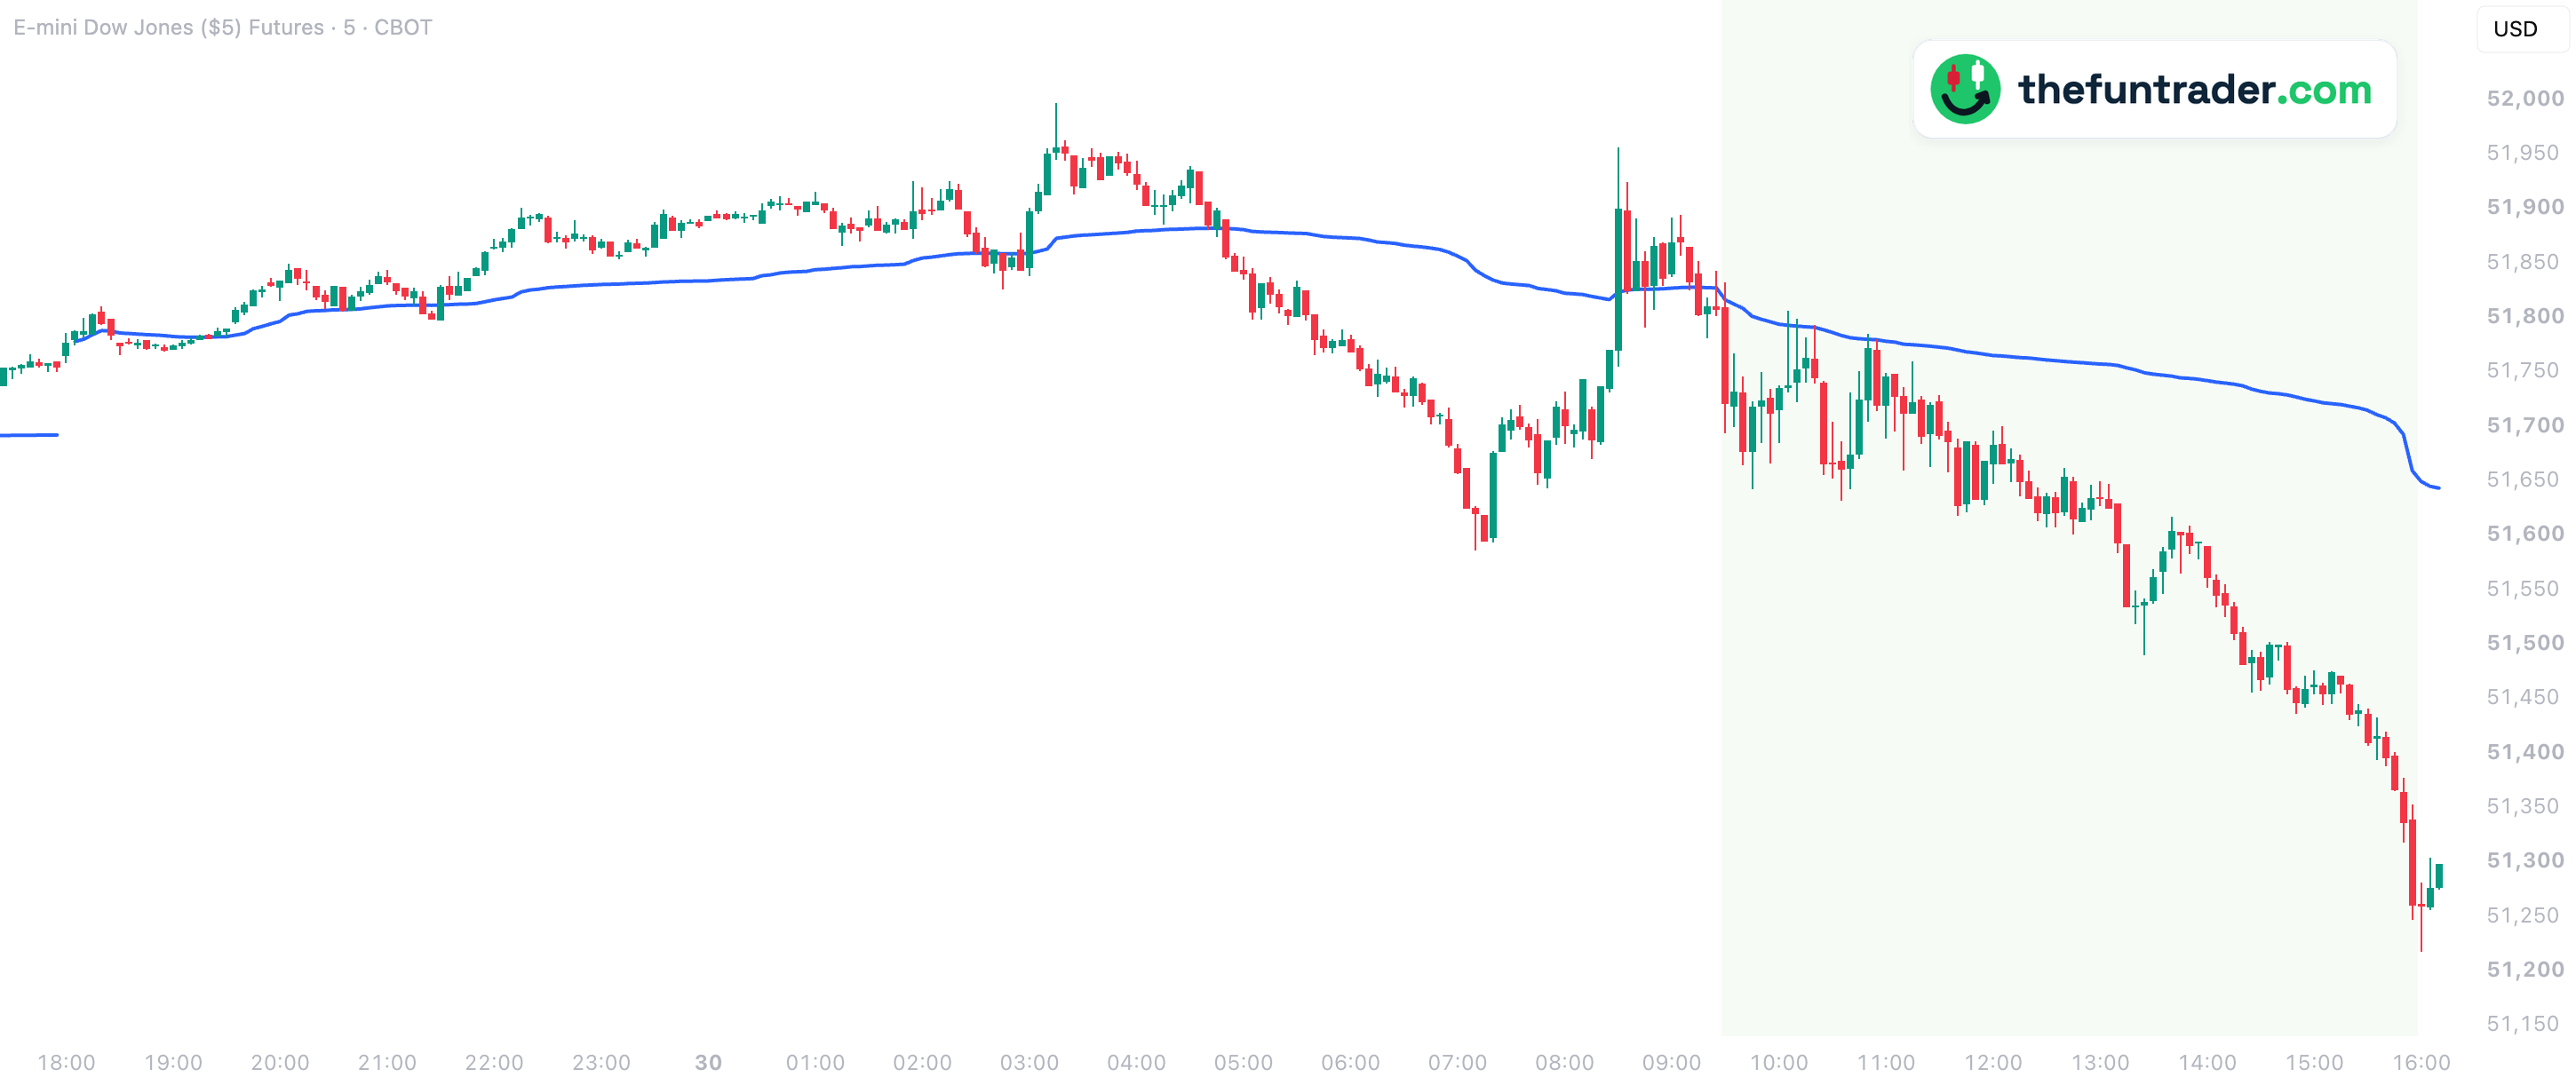 18:00 · trading day starts09:30 · stock market opens
123456

- 1Tuesday 18:00 — YM's new trading day starts. The line breaks: yesterday's VWAP ends, today's starts at the first price, 51,773, and follows the average traded price through the night.
- 2Wednesday 04:50 — YM falls below VWAP (51,882) and slides to 51,586 at 07:10.
- 308:30 — a spike to 51,956 takes YM above VWAP for a few minutes; then it drifts back to the line.
- 409:30 — the stock market opens. YM pokes 16 points above VWAP, to 51,832, and falls 138 points within five minutes.
- 510:05 and 10:50 — two more bounces stop at VWAP: 51,806 and 51,785, with VWAP at 51,793 and 51,780. Both fail.
- 615:55 — YM trades at 51,261, about 400 points below VWAP. Every bounce of the day ended at the line.
Part of Basics
Free TradingView indicator with all session, week and month levels for index, futures and CFD charts.
Install Basics (free) →What VWAP is
Every trade has a price and a size. VWAP adds up price × volume of all trades since the start of the trading day and divides that by the total volume. The result is the average price at which the day's volume changed hands — a fair-value line for that day. It starts at the first price of the session and then moves more and more slowly, because each new trade is a smaller part of the growing total.
VWAP starts again every trading day. For index futures that is when the future's trading day begins: 18:00 New York time the evening before for ES, NQ, YM and RTY, early in the morning for FDAX and the other European futures.
Why traders watch it
- Who is in control. Above VWAP, the average buyer of the day is in profit; below it, the average seller is. Many traders frame the session around that single line.
- A level that moves with the day. In a trending day, pullbacks often stop at VWAP — as on 30 September in the chart above, where every bounce ended there.
- A benchmark for large orders. Institutions often measure their execution against VWAP, which is one reason so many eyes are on it.
Why the main future's VWAP
A VWAP is only as good as the volume behind it. Most of the volume in an index trades in the main future, so its VWAP is the one the market reacts to. A micro future has much less volume, a CFD has no exchange volume at all, and an index has no volume of its own — their own VWAP would be a different, weaker line. That is why Basics always uses the main future's VWAP:
| Main future (ES, NQ, YM, RTY, FDAX, FTSE, AEX futures) | Its own VWAP |
|---|---|
| Minis, micros and nanos (for example MYM or FDXS) | The main future's VWAP, the same price as on the big contract |
| CFDs (for example NAS100 or GER40) | The main future's VWAP, converted with the current cash-future difference |
| Index charts | The main future's VWAP, converted the same way |
It is also the same on every timeframe: the line is identical on a 1-minute, 5-minute or 1-hour chart — and identical to TradingView's own session VWAP on a 1-minute chart of the main future.
How Basics shows it
| Default look | Blue, width 2 — one line through the day, without a label |
|---|---|
| Switched on by default | Yes |
| Value | The volume-weighted average price of the main future since the start of its trading day |
| Starts again | At the start of every futures trading day |
| Timeframes | Intraday charts from 1 minute, on seconds charts too, unless the level needs more history than the chart loads; not on daily or higher charts |
| Markets | Nasdaq-100, S&P 500, Dow, Russell 2000, DAX, FTSE 100 and AEX — all tickers |
| Price on your chart | Futures (main, mini, micro, nano): the main future's VWAP as it is. CFD and index charts: converted with the current cash-future difference |
Live data. During the session VWAP follows the live price feed of the main future. Without a real-time exchange subscription for that future (CME, Eurex, ICE …), TradingView delivers it 10 to 15 minutes delayed — and so is this line, even on a CFD chart that itself is real-time.
The same line on other instruments
Click a chart to enlarge it.


Why don't I see the line?
- You are on a daily or higher chart, or a seconds chart.VWAP is a line through the day; it is drawn on intraday charts from 1 minute. On a seconds chart, a level that needs more history than the chart loads is hidden.
- It is switched off.Check Main future VWAP and the master switch Show all objects in 'Session levels' group in the indicator settings.
- The line looks late.Without a real-time subscription for the main future, the line is 10 to 15 minutes delayed (see live data).
- Your ticker is not recognised.See the supported tickers — and if yours is missing, let me know: requests are very welcome.
What you can change
In the indicator settings (the gear icon next to Basics on your chart), under Session levels:
| Show / hide | Main future VWAP checkbox · Session levels |
|---|---|
| Colour and width | Any colour · width 1–5 |

Charts and defaults on this page: Basics v11.72.8 · updated 22 October 2026.
Frequently asked questions
What is VWAP in trading?
The volume-weighted average price: the average price of all trades since the start of the trading day, weighted by how much was traded at each price. It shows where the day's volume changed hands on average.
Why is the VWAP in Basics different from TradingView's VWAP on my chart?
TradingView's built-in VWAP uses the volume of the chart you are on. On a mini, micro or nano future, a CFD or an index that is a different and thinner set of trades. Basics uses the main future's VWAP, the one with the real volume behind it, and shows it on every chart type.
When does VWAP start again?
At the start of every futures trading day: 18:00 New York time the evening before for US index futures, early in the morning for the European index futures.
Does VWAP work on MES, MNQ or a GER40 CFD?
Yes. On a micro you see the main future's VWAP (ES or NQ); on a CFD it is converted with the cash-future difference, so it sits at the right price on the CFD chart.
Is the line the same on every timeframe?
Yes. A 1-minute, 5-minute or 1-hour chart all show the same line.
Related levels
See VWAP on your own chart
Basics is free on TradingView. Add it to any supported chart — for example RTY or a UK100 CFD — and the main future's VWAP appears without any setup.