D ATR H / D ATR L: where an average day ends
D ATR H and D ATR L stand for daily ATR high and daily ATR low: where today's range would end if the day makes one full average move. ATR is the average true range — the typical distance the main future, for example ES or NQ, travels in a day, averaged over the last 14 days. D ATR H is today's low plus that distance, D ATR L today's high minus it, so the two lines move with the day. Basics draws them on futures (main, mini, micro, nano) as they are, and converts them to the right price on CFD charts and charts of the official index. This page explains what the lines show, why traders watch them and how to adjust them.
On this page
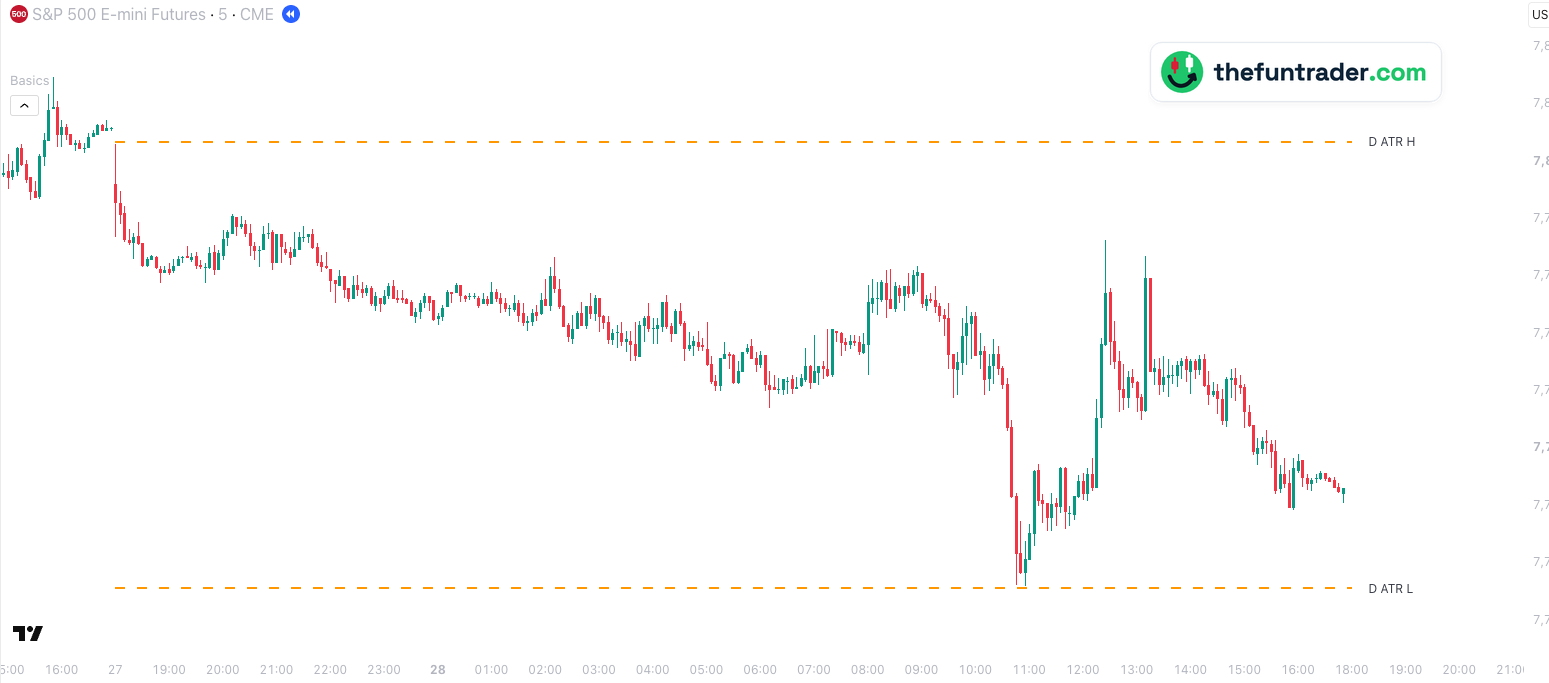 09:30 · stock market opens
1234

- 1Sunday 18:00 — the futures day starts, and the first five minutes make the high of the day: 7,803. With an average daily range of about 77 points, D ATR L sits at 7,725.56: where a full average day down from this high would end.
- 2Monday 10:45 and 10:55 — a sharp drop stops at 7,726.25 and 7,726, less than a point above D ATR L. The day has now moved one full ATR.
- 312:25 — ES is back at 7,786.25, 60 points higher.
- 417:00 — the day ends at 7,743. D ATR H ended at 7,803.44, on the high of the day: with the range equal to one ATR, the two lines frame the whole day.
Part of Basics
Free TradingView indicator with all session, week and month levels for index, futures and CFD charts.
Install Basics (free) →What the daily ATR lines show
Every index future has a typical daily range: the distance between its high and its low on an average day. The average true range (ATR) measures it over the last 14 days. For ES it was about 77 points at the end of September 2026, for NQ about 455 in mid-October.
Basics turns that average into two lines for today. D ATR H is today's low plus one ATR: how high the day can reach if it makes a full average move up from its low. D ATR L is today's high minus one ATR: how low it can go on a full average move down. Both are measured on the main future over its whole trading day, overnight included.
The lines move with the day. A new high pulls D ATR L up, a new low pulls D ATR H down. Once the day's range has reached one ATR, the two lines sit exactly on the day's high and low — as in the example above.
Why traders watch them
- A day that has done its average often slows down. When price reaches D ATR H or D ATR L, the day has moved as far as it usually does. Traders often take profit there, and fewer are willing to chase the move.
- Room left in the day. The distance from the current price to the lines shows how much of an average day is still left — useful for targets and for judging whether a move has room.
- Not a wall. On trend days and news days the range goes beyond one ATR. A clean break through the line, with price staying beyond it, says the day is anything but average.
How Basics shows them
D ATR H and D ATR L appear on every supported chart: on futures (main, mini, micro, nano) as they are, on CFD and index charts converted with the current cash-future difference. On a micro such as MES you see the lines of ES, the same as traders on the big contract.
| Default look | Orange, dashed, width 2 — both lines |
|---|---|
| Labels on the chart | D ATR H and D ATR L (renamable) |
| Switched on by default | Yes |
| Value | Today's low plus one ATR (D ATR H) and today's high minus one ATR (D ATR L), measured on the main future |
| Average | The average true range of the last 14 days (adjustable) |
| Price on your chart | Futures (main, mini, micro, nano): the main future's prices as they are. CFD and index charts: converted with the current cash-future difference |
| Where the lines start | At the start of the futures trading day; they move as the day makes new highs and lows |
| Timeframes | Charts from 1 minute up to the daily chart, on seconds charts too, unless the level needs more history than the chart loads; not on weekly or monthly charts |
| Markets | Nasdaq-100, S&P 500, Dow, Russell 2000, DAX, FTSE 100 and AEX — all tickers |
| Lookback | 1 — today only (up to 20 sessions, set in the indicator settings) |
The same lines on other instruments
Click a chart to enlarge it.


Why don't I see the lines?
- You are on a weekly or monthly chart, or a seconds chart.The lines are drawn on charts from 1 minute up to the daily chart. On a seconds chart, a level that needs more history than the chart loads is hidden.
- Price is far away from them.Lines are hidden while the level is more than 5 % from the current price, so they don't squeeze the chart. You can change this under General → Level visibility range.
- They are switched off.Check the D ATR H and D ATR L boxes and the master switch Show all objects in 'Session levels' group in the indicator settings.
- Your ticker is not recognised.See the supported tickers — and if yours is missing, let me know: requests are very welcome.
What you can change
In the indicator settings (the gear icon next to Basics on your chart), under Session levels and General:
| Show / hide | D ATR H and D ATR L checkboxes · Session levels |
|---|---|
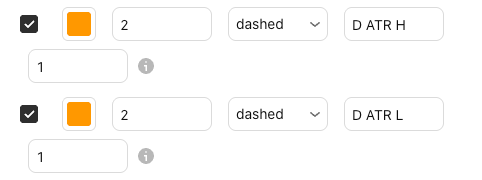
| Colour, width, style | Any colour · width 1–5 · solid, dashed or dotted |
| Label text | Default D ATR H and D ATR L |
| Lookback | 1–20 sessions (default 1: today only) |
| Daily ATR period | Default 14 days, 1–200 · General |
| Label size, line end, visibility range | Shared with all lines · General |
Charts and defaults on this page: Basics v11.72.8 · updated 21 October 2026.
Live data. The lines follow the running high and low of the main future. Without a real-time subscription for that future, TradingView delivers its prices 10–15 minutes late, and so are the lines.
Frequently asked questions
What is the ATR?
The average true range: the typical distance between a market's high and low in a day, averaged over a number of days — 14 in Basics, adjustable in the settings.
What do D ATR H and D ATR L mean?
D ATR H is today's low plus one ATR, D ATR L today's high minus one ATR: where today's range would end after one full average move up or down.
Why do the lines move during the day?
Because they are measured from today's high and low. A new high pulls D ATR L up, a new low pulls D ATR H down. Once the day's range equals one ATR, the lines sit on the high and the low.
Do the lines work on MES or MNQ?
Yes. On a micro you see the lines of the main future (ES or NQ), the same as on the big contract.
Do the lines work on a CFD?
Yes. On a CFD such as US500 or GER40 they are converted with the current cash-future difference.
Related levels
See the daily ATR lines on your own chart
Basics is free on TradingView. Add it to any supported chart — for example ES or FDXM — and the daily ATR lines appear without any setup.