RTH O: the regular trading hours open price
RTH O stands for regular trading hours open: the price of your chart at the moment the official stock market opens — for example 09:30 New York for the S&P 500, 09:00 Berlin for the DAX. Basics draws it as a line on charts of the official index, futures and CFDs. This page explains what the line shows, why traders watch it all day and how to adjust it.
On this page
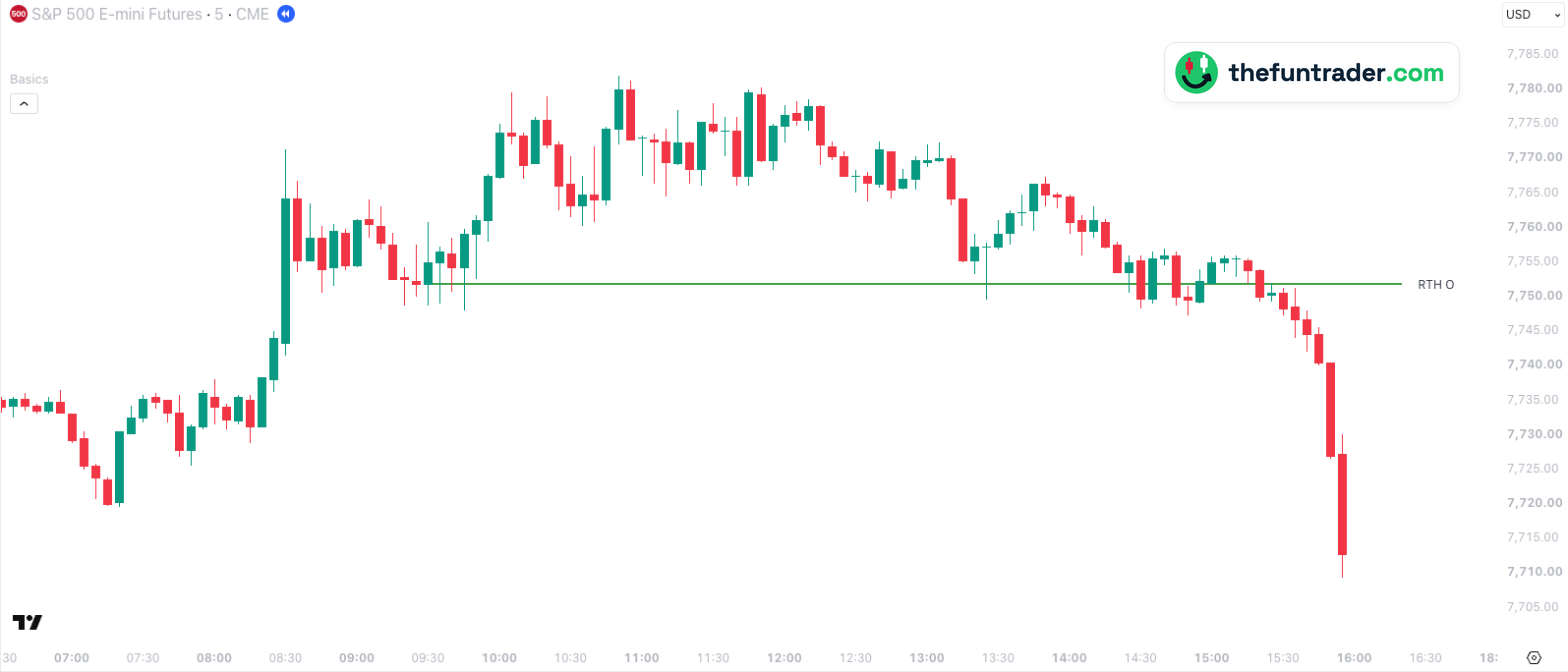 09:30 · stock market opens
123

- 109:30 — regular trading hours start. At that moment ES trades at 7,751.75 (ES itself has been trading since the evening before), and Basics draws RTH O from this candle. The market then rallies to about 7,782.
- 213:25 — price comes back to RTH O for the first time, wicks to 7,749 and bounces about 15 points: RTH O holds as support.
- 3After more tests between 14:30 and 15:20 RTH O gives way at 15:30 — at the 16:00 close ES is 39 points below it, at 7,712.75.
Part of Basics
Free TradingView indicator with all session, week and month levels for index, futures and CFD charts.
Install Basics (free) →What RTH O is
RTH stands for regular trading hours: the hours the underlying stock market is open. For the US indices, for example the S&P 500, that is 09:30 to 16:00 New York time.
Index futures such as NQ and ES trade almost around the clock. Their trading day starts at 18:00 New York time the evening before, so the opening price of a daily futures candle is set overnight — a price set in thin trading, hours before most participants are at their desks. RTH O is the price at 09:30, the moment the cash market and most of the day's volume arrive.
Why traders watch it all day
The opening price is where the market agreed on value when the full crowd showed up. Everything after that is either acceptance above it or below it. That makes RTH O useful long after 09:30:
- Direction of the day. Trading above RTH O means buyers have had the upper hand since the regular session started; below it, sellers have. Many traders frame their bias for the session around that single line.
- Retests. When price returns to RTH O later in the day it often reacts — a hold confirms the trend of the day, a clean break through it often marks a change.
- A neutral reference. Unlike a moving average or an indicator value, the opening price is a fact. Every trader on ES sees the same price.
How Basics shows it
Basics draws RTH O automatically from the first candle of regular trading hours. It works on every supported index, futures and CFD chart — for example ES, or a CFD such as GER40. See the full list of supported tickers.
| Default look | Green, solid, width 2 |
|---|---|
| Label on the chart | RTH O (renamable) |
| Switched on by default | Yes |
| Timeframes | Charts from 1 minute up to the daily chart, on seconds charts too, unless the level needs more history than the chart loads; not on weekly or monthly charts |
| Regular trading hours start | 09:30 New York (US indices), 09:00 Berlin (DAX), 08:00 London (FTSE 100), 09:00 Amsterdam (AEX) — all markets |
| Based on | The chart you are looking at. On mini, micro and nano futures (for example MES or FDXM): the opening price of the main future |
| Lookback | 1 — today's opening price only (up to 20 sessions, set in the indicator settings) |
The same open on other instruments
RTH O works the same way on every supported chart. On a micro future you see the main future's price at that moment; on a CFD you see the CFD's own price at the moment the stock market opens. Click a chart to enlarge it.


Why don't I see the line?
- The stock market has not opened yet.On futures and CFD charts a new session starts when the pre-market begins — 18:00 New York the evening before for US futures, early morning Berlin time for the DAX. Yesterday's RTH O is removed then, and today's line appears when the stock market opens. To keep yesterday's RTH O on the chart, set the lookback of RTH O to 2 or more in the indicator settings.
- You are on a weekly or monthly chart, or a seconds chart.RTH O is drawn on charts from 1 minute up to the daily chart. On a seconds chart, a level that needs more history than the chart loads is hidden.
- Price is far away from it.Lines are hidden while the level is more than 5 % from the current price, so they don't squeeze the chart. The line returns when price comes closer. You can change this under General → Level visibility range.
- It is switched off.Check the RTH O box and the master switch Show all objects in 'Session levels' group in the indicator settings.
- Your ticker is not recognised.See the supported tickers — and if yours is missing, let me know: requests are very welcome.
What you can change
Everything about the line can be adjusted in the indicator settings (the gear icon next to Basics on your chart).
| Show / hide | RTH O checkbox · Session levels |
|---|---|
| Colour, width, style | Any colour · width 1–5 · solid, dashed or dotted |
| Label text | Default RTH O |
| Lookback | 1–20 sessions (default 1: today only) |
| Label size | Default 12 pt · General (applies to all labels) |
| Line end | Right edge + offset (default: 5 candles past the last candle, never past the session end) or Fixed end time · General |
| Level visibility range | Default 5 % of price · General (applies to all level lines) |

Charts and defaults on this page: Basics v11.72.8 · updated 21 October 2026.
Not the same as the official index opening price. The Nasdaq-100 and S&P 500 have their own official opening price, and it is not the same price as the ES or NQ opening price. Basics draws that as a separate line: RTH O index.
Frequently asked questions
When do regular trading hours start for NQ and ES?
09:30 New York time (Eastern Time). Regular trading hours run until 16:00, the same hours as the US stock market. Basics works in any chart timezone; tip: set your chart to New York time if you want the times on your chart to match these hours.
Is RTH O the same as the daily opening price on a futures chart?
No. The futures trading day starts at 18:00 New York time the evening before, so a daily ES or NQ candle opens overnight. RTH O is the price at 09:30.
When do regular trading hours start on the DAX?
09:00 Berlin time, when Xetra opens. Basics works in any chart timezone; tip: put DAX, FDAX and GER40 charts on Berlin time so the times on the chart match. Opening times of all markets are on the supported tickers page.
Does RTH O work on MES and MNQ?
Yes. On micro futures Basics shows the opening price of the main future (ES or NQ), not the micro's own, which can differ by a few points. So you see the same level as traders on the big contract.
Does it work on a US500 or NAS100 CFD?
Yes. On a CFD, RTH O shows the CFD's own price at 09:30.
Related levels
See RTH O on your own chart
Basics is free on TradingView. Add it to any supported chart — for example ES or MNQ — and RTH O appears without any setup.