PmC future b-adj: last month's closing price after a roll
PmC future b-adj stands for previous month close, future, back-adjusted: last month's closing price of the main future — for example ES or NQ — expressed in the prices of the new contract after a quarterly roll. When the roll falls in the new month, last month's closing price is a price of the old contract. Basics then draws it twice: as it traded (PmC future) and in the new contract's prices (b-adj). This page explains when the b-adj line appears, what it shows and how to read the two versions together.
On this page
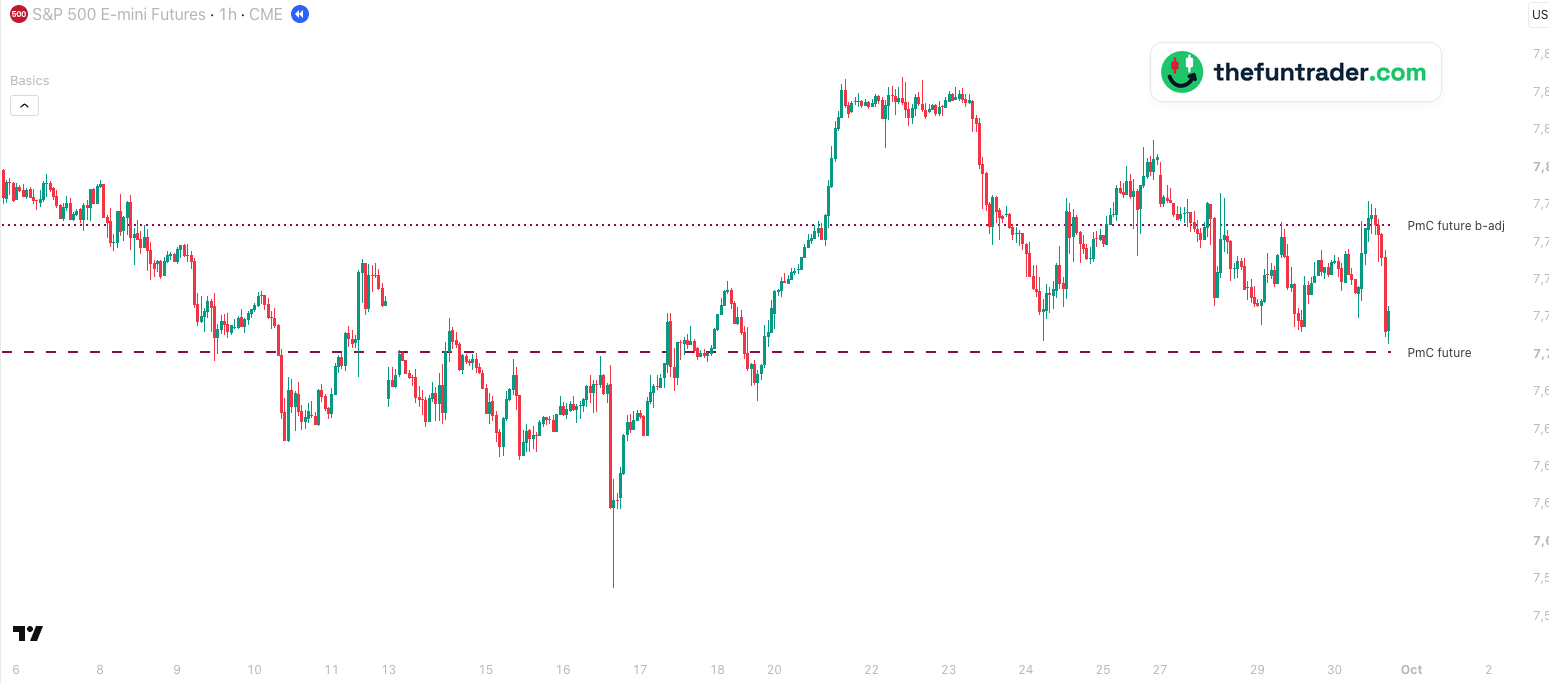 Monday 14 Sep · ES switches to December
123456

- 1ES's last price of August: 7,701.25 in the September contract (PmC future), 7,769 in December prices (PmC future b-adj).
- 2Monday 14 September, 18:00 — ES1! switches from the September to the December contract, 67.75 points higher.
- 3Monday 21 September — ES rallies above both lines to 7,848.50 the next day.
- 4Thursday 24 September, 05:00 — the drop stops at 7,707.25, six points above PmC future; ES climbs to 7,783.50 that day.
- 5Tuesday 29 September, 07:00 — the rebound stalls at 7,770.75, 1.75 points above PmC future b-adj; ES falls to 7,712.25.
- 6Wednesday 30 September, 16:00 — another drop stops at 7,705.50, again just above PmC future. For a week ES traded between the two lines.
Part of Basics
Free TradingView indicator with all session, week and month levels for index, futures and CFD charts.
Install Basics (free) →What the b-adj line shows
Index futures expire every quarter. Around expiry TradingView's continuous chart — ES1!, NQ1!, FDAX1! — switches to the next contract, which trades at a different price, usually a little higher (the cash-future difference of three more months). In the example above, ES's December contract traded 67.75 points above the September contract.
If the switch happens after last month ended, last month's closing price is a price of the old contract. PmC future shows it as it traded; PmC future b-adj shows it shifted by that gap, so in the new contract's prices. Both are fixed values.
When it appears
Only while the two versions differ: from the moment of the roll until the end of that month. After the September 2026 roll that was from 14 September (ES, NQ, YM) or 18 September (FDAX) until 30 September. The rest of the quarter the b-adj line is not drawn.
Which line counts?
Both can. The normal line is a price that really traded, in the old contract; the b-adj line is where that same level sits in the new contract's prices. Traders who look at an unadjusted chart see the first, traders on a back-adjusted chart see the second, so in the days after a roll price often reacts to one of them — and sometimes to both, as from 24 to 30 September in the chart above. Read the space between the two lines as a zone rather than two separate prices.
One thing to keep in mind on a back-adjusted chart (TradingView's B-ADJ button on): candles from before the roll are shifted to the new contract's prices, so they line up with the b-adj lines. With B-ADJ off they line up with the normal lines. The lines themselves don't move with the button. More on this in back-adjusted levels explained.
How Basics shows it
The b-adj line appears on every supported chart, like PmC future: on futures (main, mini, micro, nano) as it is, on CFD and index charts converted with the current cash-future difference.
| Default look | Dark pink, dotted, width 2 — the colour and width of PmC future |
|---|---|
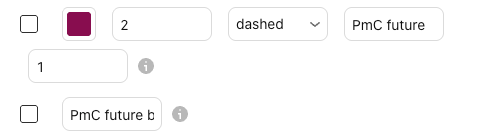
| Label on the chart | PmC future b-adj (renamable) |
| Switched on by default | No |
| Value | Last month's closing price of the main future, from the back-adjusted contract series |
| Price on your chart | Futures (main, mini, micro, nano): the main future's price as it is. CFD and index charts: converted with the current cash-future difference |
| Where the line starts | Where PmC future starts: when the new futures month begins |
| Timeframes | Charts from 1 minute up to the weekly chart, on seconds charts too, unless the level needs more history than the chart loads; not on monthly charts |
| Markets | Nasdaq-100, S&P 500, Dow, Russell 2000, DAX, FTSE 100 and AEX — all tickers |
The same level on other instruments
Click a chart to enlarge it.

Why don't I see the line?
- There was no roll recently.The b-adj line only appears while it differs from the normal line: from the roll until the end of that month. The rest of the quarter the two are the same, and only the normal line is drawn.
- It is switched off.The b-adj lines are off by default. Check the box under Futures levels and the master switch Show all objects in 'Futures levels' group in the indicator settings.
- You are on a monthly chart, or on a seconds chart that loads too little history.The line is drawn on charts from 1 minute up to the weekly chart.
- Price is far away from it.Lines are hidden while the level is more than 5 % from the current price, so they don't squeeze the chart. You can change this under General → Level visibility range.
- Your ticker is not recognised.See the supported tickers — and if yours is missing, let me know: requests are very welcome.
What you can change
In the indicator settings (the gear icon next to Basics on your chart), under Futures levels:
| Show / hide | PmC future b-adj checkbox, off by default · Futures levels |
|---|---|
| Label text | Default PmC future b-adj |
| Colour and width | The same as the normal line; the b-adj line is always dotted |
| When it appears | Only while it differs from the normal line — right after a quarterly roll |
| Label size, line end, visibility range | Shared with all lines · General |
Charts and defaults on this page: Basics v11.72.8 · updated 21 October 2026.
Frequently asked questions
What does b-adj mean?
Back-adjusted: the level comes from TradingView's back-adjusted contract series, in which older prices are shifted by the gap between the old and the new contract.
Why are there two lines for last month's closing price?
When the main future switches to the next contract after last month ended, last month's closing price is a price of the old contract. PmC future shows it as it traded; PmC future b-adj shows it in the new contract's prices.
When is PmC future b-adj drawn?
Only while it differs from PmC future: from the roll until the end of that month.
Which one should I use?
Watch both: price can react to either, as the examples on this page show.
Does the chart's B-ADJ button move the lines?
No. Both lines are fixed values. The button only shifts the candles from before the roll.
Related levels
See PmC future b-adj on your own chart
Basics is free on TradingView. Switch on PmC future b-adj under Futures levels, and after the next quarterly roll you see last month's closing price in both contracts.