D SMA future b-adj: the back-adjusted daily averages
D SMA future b-adj is the back-adjusted version of the daily averages of the main future (D SMA future): the same 20, 50 or 200 daily closes, but from TradingView's back-adjusted contract series, in which older contracts are shifted to the current contract's prices. After a quarterly roll the two versions can be hundreds of points apart, and price can react to either. Basics draws the b-adj version as a dotted line in the colour of the normal average, on futures as it is and converted on CFD and index charts. It is off by default.
On this page
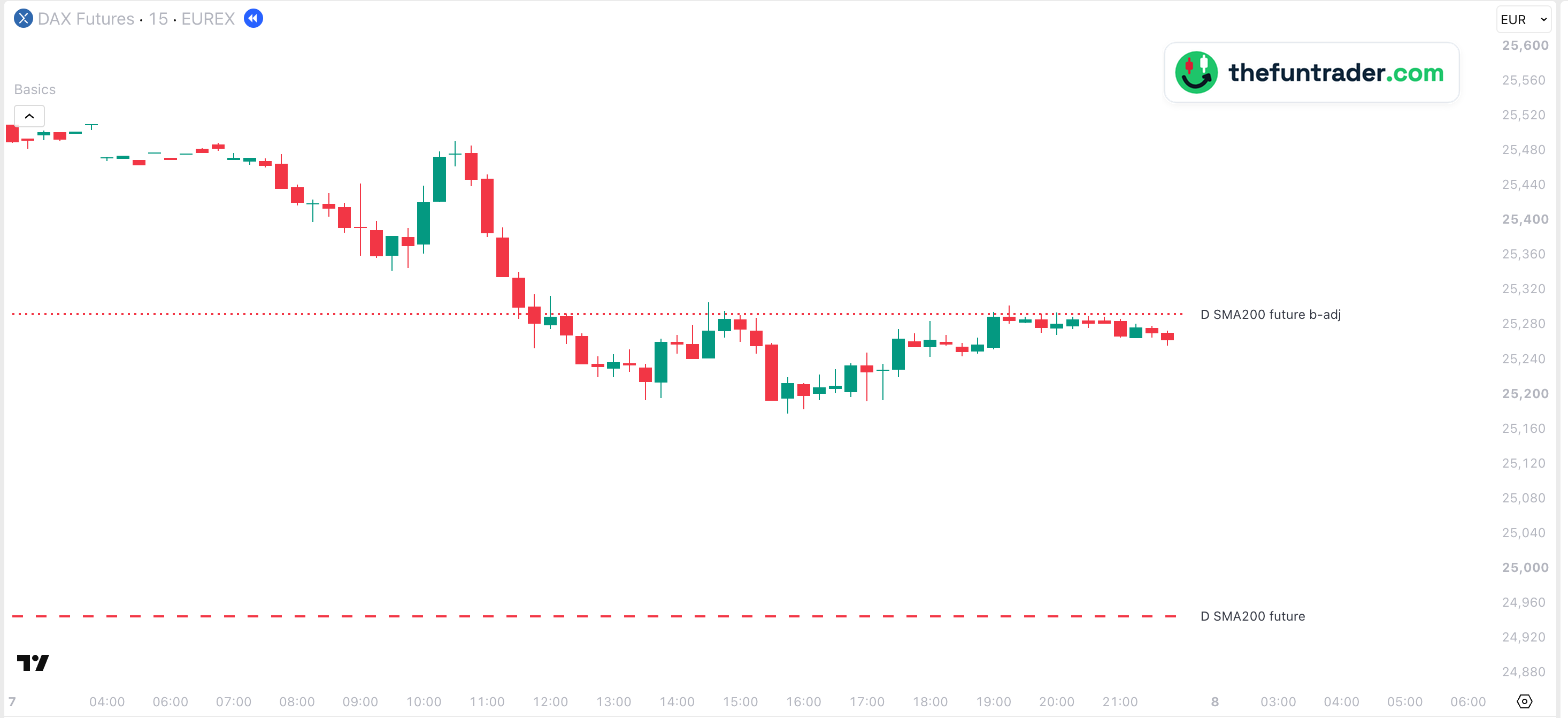 09:00 · Xetra opens
123456

- 102:15 — FDAX's day starts. The 200-day average on the back-adjusted series: 25,292. The same average without adjustment: 24,945, 347 points lower.
- 210:30 — the high of the day: 25,491.
- 311:45 — FDAX falls through the b-adj line. The bounce at 12:00 reaches 25,313 and fails.
- 414:30 — second test: 25,306, rejected again. The low of the day follows at 15:45: 25,178.
- 519:00–20:30 — FDAX creeps back to the line: 25,295, 25,302, 25,294. After 11:45 not one quarter hour closes above it.
- 6The not-adjusted D SMA200 future, 24,945: far away today. The next day FDAX fell to it — see below.
Part of Basics
Free TradingView indicator with all session, week and month levels for index, futures and CFD charts.
Install Basics (free) →Two versions of the same average
Every quarter the main future moves to a new contract, which trades at a different price — for FDAX in September 2026 the new contract was 186 points higher. A daily average of the future then mixes closes of different contracts. There are two ways to deal with that:
| D SMA future | Averages the closes as they traded, each in its own contract. Many futures traders watch this one. |
|---|---|
| D SMA future b-adj | Averages TradingView's back-adjusted closes: everything before a roll is shifted by the roll gap, so the history connects without jumps. This is the average you see when you add a moving average to a back-adjusted daily chart with SET (settlement as close) on. |
The difference depends on how many old-contract closes are inside the average. D SMA20 and D SMA50 only differ for 20 and 50 trading days after a roll. A quarter has about 63 trading days, so D SMA200 always contains several rolls: its two versions are never the same — on 7 October 2026 they were 347 points apart on FDAX.
Which one counts?
Both can. Traders on a back-adjusted chart see the b-adj value, traders on an unadjusted chart the normal one, so price often reacts to whichever is close. The example above shows it on two days in a row: on Wednesday the b-adj line capped every bounce; on Thursday FDAX fell to the normal line and held there. More on rolls and back-adjusting: back-adjusted levels explained.
How Basics shows them
Each daily average of the future — 20, 50 and 200 — has its own b-adj checkbox. The b-adj lines appear on every supported chart: on futures (main, mini, micro, nano) as they are, on CFD and index charts converted with the current cash-future difference — exactly like the normal lines.
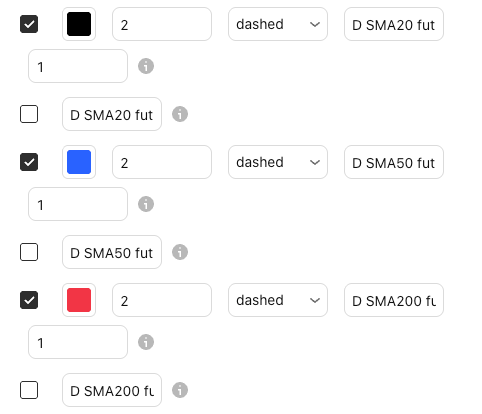
| Default look | Dotted, in the colour and width of the normal average: D SMA20 black, D SMA50 blue, D SMA200 red |
|---|---|
| Labels on the chart | D SMA20 future b-adj, D SMA50 future b-adj, D SMA200 future b-adj (renamable) |
| Switched on by default | No |
| Value | The average of the last 20, 50 or 200 daily closes (settlement prices) on TradingView's back-adjusted series, with today's current price as today's close |
| Price on your chart | Futures (main, mini, micro, nano): the main future's price as it is. CFD and index charts: converted with the current cash-future difference |
| Where the line is drawn | Today only: one line per average, from the start of today's futures session — no lookback |
| Timeframes | Charts from 1 minute up to the daily chart, on seconds charts too, unless the level needs more history than the chart loads; not on weekly or monthly charts |
| Markets | Nasdaq-100, S&P 500, Dow, Russell 2000, DAX, FTSE 100 and AEX — all tickers |
The next day: the normal average
Click the chart to enlarge it.

Why don't I see the lines?
- They are switched off.The b-adj lines are off by default. Check the … b-adj box below each daily average under Futures SMAs, and the master switch Show all objects in 'Futures SMAs' group in the indicator settings.
- You are looking at an earlier day.A b-adj line is drawn for today only; earlier days keep no b-adj line.
- You are on a timeframe without them.The lines are drawn on charts from 1 minute up to the daily chart.
- Price is far away from them.Lines are hidden while the level is more than 5 % from the current price, so they don't squeeze the chart. You can change this under General → Level visibility range.
- Your ticker is not recognised.See the supported tickers — and if yours is missing, let me know: requests are very welcome.
What you can change
In the indicator settings (the gear icon next to Basics on your chart), under Futures SMAs:
| Show / hide | A … b-adj checkbox below each daily future average · Futures SMAs |
|---|---|
| Colour, width | Taken from the normal average above it; the b-adj line is always dotted |
| Label text | Default D SMA20 future b-adj, D SMA50 future b-adj, D SMA200 future b-adj |
| Label size, line end, visibility range | Shared with all lines · General |
Charts and defaults on this page: Basics v11.72.8 · updated 21 October 2026.
Frequently asked questions
What does b-adj mean?
Back-adjusted: calculated on TradingView's back-adjusted contract series, in which older contracts are shifted to the current contract's prices.
Why is D SMA200 future b-adj so far from D SMA200 future?
200 trading days contain several quarterly rolls. Every roll gap shifts the older closes in the back-adjusted series, and the shifts add up.
Does the chart's B-ADJ button move the lines?
No. Both versions are fixed values; the button only changes how TradingView draws the candles from before a roll.
Which one should I use?
That is a matter of preference: many futures traders watch the normal average, traders on back-adjusted charts the b-adj one. Price can react to both, as the example on this page shows.
Does it work on a CFD or an index chart?
Yes. Like the normal future averages, the b-adj lines are converted with the current cash-future difference.
Related levels
See both versions on your own chart
Basics is free on TradingView. Add it to any supported chart — for example FDAX or MES — and switch on the b-adj averages under Futures SMAs.