Cw 50% / Cw 61.8% future: the levels inside this week's range
Cw 50% and Cw 61.8% future are two levels inside this week's range of the main future — for example ES or YM: the middle of the range, and the 61.8 % retracement of the week's move. When price pulls back after a strong move, these are two of the places where it often turns. The lines move with every new high or low of the week. Basics draws them on futures (main, mini, micro, nano) as they are, and converts them to the right price on CFD and index charts. They are switched off by default; this page explains what they show and how to switch them on.
On this page
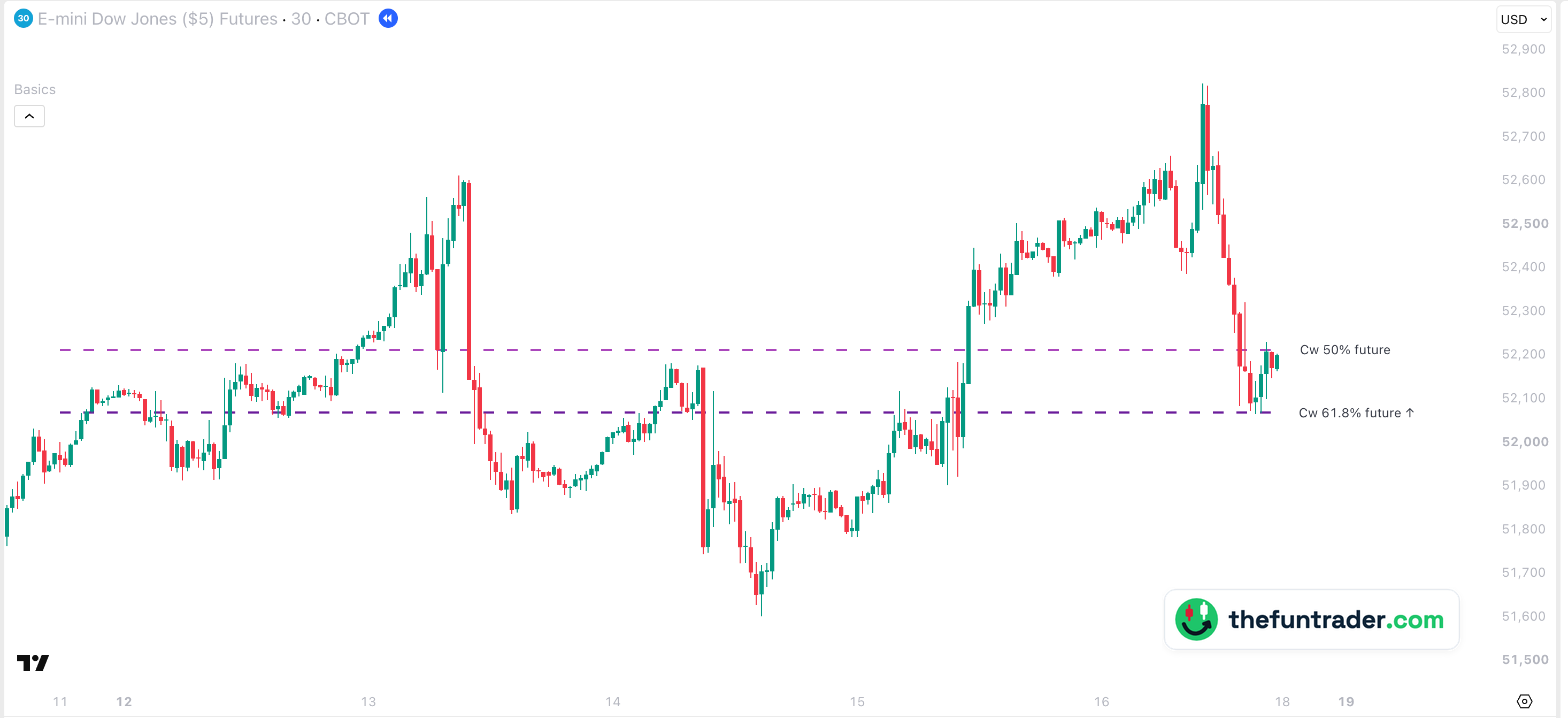 Sunday 18:00 · futures week starts
12345

- 1Sunday 11 October, 18:00 — the futures week starts, and the lines start here. They move with every new high or low of the week; the chart shows where they ended.
- 2Wednesday 14 October, 14:00 — the low of the week: 51,602.
- 3Friday 16 October, 09:30 — the high of the week: 52,823. The range is now 1,221 points: Cw 50% = 52,212.50. The high came after the low, so Cw 61.8% ↑ is measured down from the high: 52,068.42.
- 413:00 — after a fall of 740 points YM stops at 52,083, 15 points above Cw 61.8%. It tests the line three more times — 52,073, 52,065 and 52,068 — and every half hour closes above it.
- 5The bounce stalls around Cw 50%: 52,231 at 15:30. The week ends at 52,200, between the two lines.
Part of Basics
Free TradingView indicator with all session, week and month levels for index, futures and CFD charts.
Install Basics (free) →What the two lines show
Every week the main future builds a range: from the lowest to the highest price since the futures week started, pre-market and after-hours included. Basics draws two levels inside it:
- Cw 50% future — the middle of the range, halfway between the week's high and low.
- Cw 61.8% future — the 61.8 % retracement of the week's move: how far price has come back from the latest extreme. 61.8 % is the best-known Fibonacci ratio, and many traders watch it as the level where a pullback should hold if the move is to continue.
The range only grows during the week, so the lines move with it: a new high or a new low shifts both. Early in the week the range is small and the levels mean little — that is why Basics only shows them once the range is at least 1 % of the price (adjustable).
Which way the 61.8 % is measured
The label shows an arrow:
| Cw 61.8% future ↑ | The week's high came after its low — the week moved up. The level lies below the high: the high minus 61.8 % of the range. |
|---|---|
| Cw 61.8% future ↓ | The week's low came after its high — the week moved down. The level lies above the low: the low plus 61.8 % of the range. |
In the example above the high came on Friday, after Wednesday's low, so the arrow points up and the line lies 61.8 % of the range below the high.
Why traders watch them
- Where a pullback can stop. After a strong move, the 50 % and 61.8 % levels of that move are classic places for a pullback to end — and for traders to join the move again.
- The middle of the week. Above Cw 50% the week is in its upper half, below it in its lower half; price often pauses there.
- Not a wall. When price closes well beyond the 61.8 % level, the pullback has become more than a pullback; the week's move is in question.
How Basics shows them
Both lines appear on every supported chart: on futures (main, mini, micro, nano) as they are, on CFD and index charts converted with the current cash-future difference. On a micro such as MYM you see the lines of YM, the same as traders on the big contract.
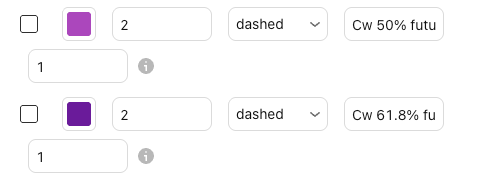
| Default look | Purple (50 %) and dark purple (61.8 %), dashed, width 2 |
|---|---|
| Labels on the chart | Cw 50% future and Cw 61.8% future with ↑ or ↓ (renamable) |
| Switched on by default | No |
| Value | The middle and the 61.8 % retracement of the main future's range this week, pre-market and after-hours included |
| Shown from | A week's range of at least 1 % of the price (adjustable; 0 = always) |
| Price on your chart | Futures (main, mini, micro, nano): the main future's prices as they are. CFD and index charts: converted with the current cash-future difference |
| Where the lines start | At the start of the week's first futures session, like CwO future; they move with the range |
| Timeframes | Charts from 1 minute up to the daily chart, on seconds charts too, unless the level needs more history than the chart loads; not on weekly or monthly charts |
| Markets | Nasdaq-100, S&P 500, Dow, Russell 2000, DAX, FTSE 100 and AEX — all tickers |
| Lookback | 1 — this week only (up to 20 weeks) |
Another week, another market
Click the chart to enlarge it.

Why don't I see the lines?
- They are switched off.Both lines are off by default. Check the boxes under Futures levels and the master switch Show all objects in 'Futures levels' group in the indicator settings.
- The week's range is still small.The lines appear once the range is at least 1 % of the price. You can change this under General → Week range lines — minimum range; 0 shows them always.
- You are on a timeframe without them.The lines are drawn on charts from 1 minute up to the daily chart.
- Price is far away from them.Lines are hidden while the level is more than 5 % from the current price, so they don't squeeze the chart. You can change this under General → Level visibility range.
- Your ticker is not recognised.See the supported tickers — and if yours is missing, let me know: requests are very welcome.
What you can change
In the indicator settings (the gear icon next to Basics on your chart), under Futures levels:
| Show / hide | Cw 50% future and Cw 61.8% future checkboxes · Futures levels |
|---|---|
| Colour, width, style | Any colour · width 1–5 · solid, dashed or dotted — per line |
| Label text | Default Cw 50% future and Cw 61.8% future {direction}; {direction} becomes the arrow |
| Lookback | 1–20 weeks (default 1: this week only) |
| Minimum range | Default 1 % of the price; 0 = always · General → Week range lines — minimum range |
| Label size, line end, visibility range | Shared with all lines · General |
Charts and defaults on this page: Basics v11.72.8 · updated 21 October 2026.
Live data. The lines follow the main future's running high and low. Without a real-time subscription for that future, TradingView delivers its prices 10–15 minutes late, and so are the lines.
Frequently asked questions
What does the arrow in Cw 61.8% mean?
↑: the week's high came after its low, so the level is measured down from the high. ↓: the low came after the high, so it is measured up from the low.
Why do the lines move?
They are calculated from this week's high and low. A new high or a new low changes the range, and both lines move with it.
Why don't I see the lines on Monday?
They appear once the week's range is at least 1 % of the price. Set Week range lines — minimum range under General to 0 to always show them.
Does it work on MYM or MES?
Yes. On a micro you see the lines of the main future (YM or ES), the same as on the big contract.
Does it work on a CFD?
Yes. On a CFD such as US30 or GER40 the lines are converted with the current cash-future difference.
Related levels
See this week's range levels on your own chart
Basics is free on TradingView. Add it to any supported chart — for example YM or MES — and switch on Cw 50% and Cw 61.8% future under Futures levels.