PwH / PwL future: the future's high and low of last week
PwH future and PwL future stand for previous week high, future and previous week low, future: the highest and lowest price of the main future — for example ES or FDAX — over its whole previous trading week. A futures week is much longer than the stock market's: it includes every night, every pre-market and every after-hours session. So these levels often lie further out than the official index's own weekly high and low — and they are often set while the stock market is closed. Basics draws them on the main future and also on its mini, micro and nano contracts — always the main future's high and low, not the smaller contract's own, which can differ through a spike in the thinner market. On CFDs such as US500 or GER40, which follow the index rather than the future, Basics converts them with the current cash-future difference, so the lines land where they belong on the CFD chart. This page explains what the lines show, how the futures week differs from the stock market's week, and how to adjust them.
On this page
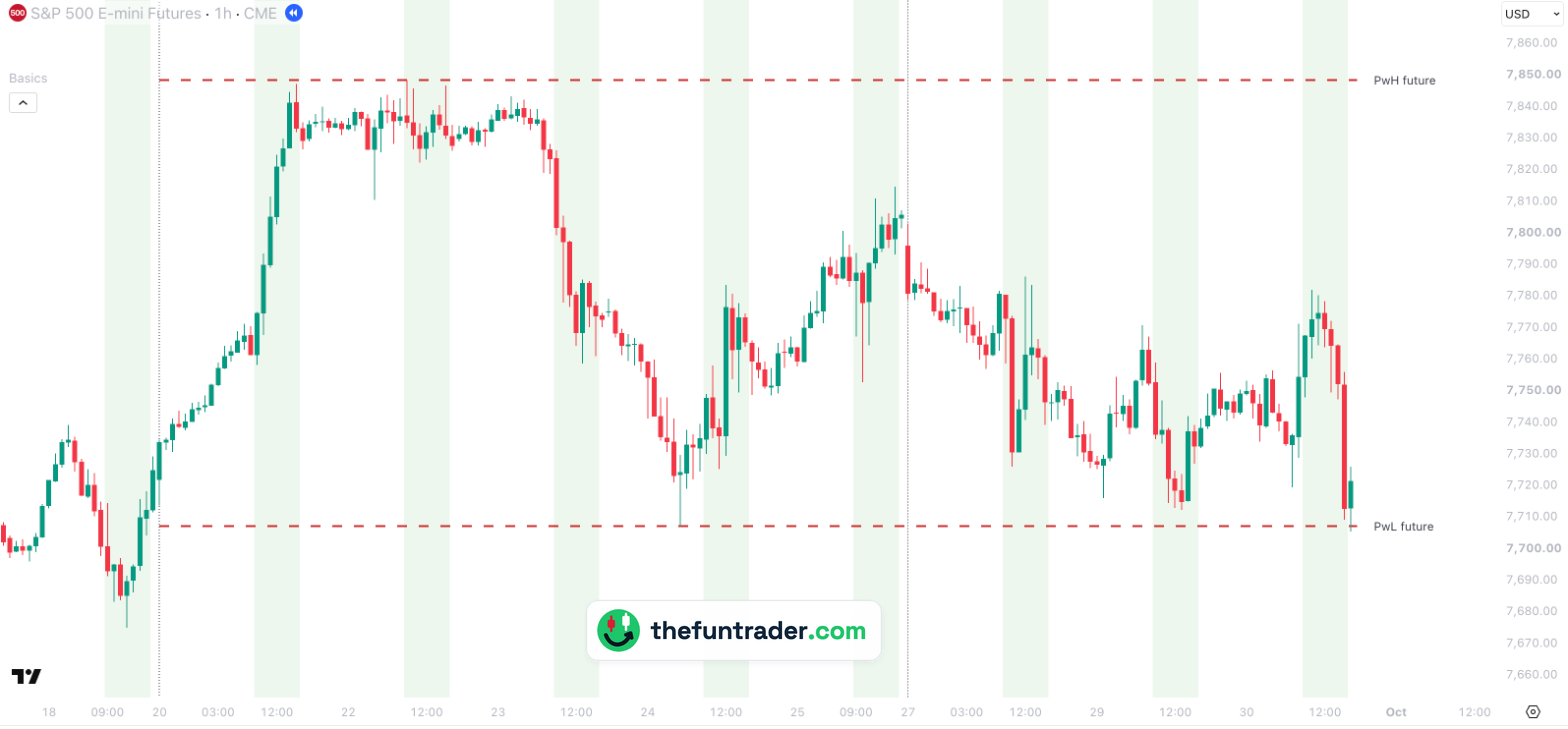 Week of 21 Sep startsNew week
1234

- 1Sunday 20 September, 18:00 — the futures week starts, and so do the lines. On Tuesday at 09:35, just after the stock market opens, ES makes the week's high: 7,848.50.
- 2Thursday 24 September, 05:40 — hours before the stock market opens, ES makes the week's low: 7,707.25. The S&P 500 itself was not trading at that moment; only the future has this level.
- 3Sunday 27 September, 18:00 — a new futures week starts, and last week's high and low become PwH future and PwL future.
- 4Wednesday 30 September, 16:00 — the stock market has just closed. ES drops to 7,705.50, 1.75 points under the line, and turns: 7,726 at 16:25.
Part of Basics
Free TradingView indicator with all session, week and month levels for index, futures and CFD charts.
Install Basics (free) →What a futures week is
The stock market behind an index is open six and a half (US) or eight and a half (DAX) hours a day, five days a week. Index futures trade almost around the clock:
| US index futures (NQ, ES, YM, RTY) | Sunday 18:00 until Friday 17:00 New York time, with a one-hour break each day |
|---|---|
| DAX future (FDAX, FDXM, FDXS) | Monday 02:15 Berlin time (01:15 in winter) until Friday 22:00 |
| FTSE 100 future | Sunday 22:00 (first trade Monday 01:00) until Friday 21:00 London time |
| AEX future (FTI, MFA) | Monday 08:00 until Friday 22:00 Amsterdam time |
| Regular trading hours, for comparison | Monday–Friday 09:30–16:00 New York, 09:00–17:30 Berlin, 08:00–16:30 London, 09:00–17:30 Amsterdam |
PwH future and PwL future are the highest and lowest price over that whole week. News before the stock market opens, reactions in the evening, a quiet Sunday night — all of it counts. That is why the future's weekly high or low is often set outside regular trading hours, as on Thursday 24 September in the chart above.
PwH / PwL future or PwH / PwL index?
Basics also draws last week's high and low of the index itself, during regular trading hours only: PwH / PwL index. The two pairs differ in three ways:
- Period. The future's levels cover the full futures week, the index's levels only the stock market's hours.
- Price level. The future trades at a premium or discount to the index (the cash-future difference). Basics converts the index's levels to futures prices, so on your chart you compare like with like.
- Where the line starts. The future's lines start at the beginning of last week's futures trading, the index's lines at last week's first stock market open.
An example from the DAX: in the week of 28 September FDAX made its high, 25,806, on Monday at 19:10 — after Xetra had closed. The DAX's own weekly high, converted to FDAX prices, lies about 50 points lower. On a chart with both pairs you see both levels.
How Basics shows them
PwH future and PwL future are not only for futures traders. Basics also draws them on CFD and index charts, converted with the cash-future difference — on a CFD such as US500, for example, the future's weekly high and low sit where they belong on the CFD chart.
| Default look | Dark red, dashed, width 2 — both lines |
|---|---|
| Labels on the chart | PwH future and PwL future (renamable) |
| Switched on by default | Yes |
| Value | The main future's highest and lowest price over the full previous trading week |
| Where the lines start | At the start of last week's futures trading (Sunday 18:00 New York, Monday 02:15 Berlin, Sunday 22:00 London, Monday 08:00 Amsterdam) |
| Timeframes | Charts from 1 minute up to the daily chart, on seconds charts too, unless the level needs more history than the chart loads; not on weekly or monthly charts |
| Markets | Nasdaq-100, S&P 500, Dow, Russell 2000, DAX, FTSE 100 and AEX — all tickers |
| Price on your chart | Futures (main, mini, micro, nano): the main future's prices as they are. CFD and index charts: converted with the current cash-future difference |
| Lookback | 1 — last week only (up to 20 weeks in the settings; weeks older than about four weeks are not drawn) |
The week right after a quarterly roll? Then last week's high or low can come from the old contract. Basics can also draw a b-adj version of both lines, from the back-adjusted contract series; it only appears while the two differ. These extra lines are off by default, under Futures levels; see PwH / PwL future b-adj.
The same levels on other instruments
Click a chart to enlarge it.


Why don't I see the lines?
- A new week has only just started.Last week's high and low become PwH/PwL future when the new futures week begins — for US futures on Sunday at 18:00 New York time.
- The label shows another name.When last week's high or low is also yesterday's, or last month's, the line is labelled for example PsH/PwH future or PwL/PmL future.
- You are on a weekly or monthly chart, or a seconds chart.The lines are drawn on charts from 1 minute up to the daily chart. On a seconds chart, a level that needs more history than the chart loads is hidden.
- Price is far away from them.Lines are hidden while the level is more than 5 % from the current price, so they don't squeeze the chart. You can change this under General → Level visibility range.
- They are switched off.Check the PwH future and PwL future boxes and the master switch Show all objects in 'Futures levels' group in the indicator settings.
- Your ticker is not recognised.See the supported tickers — and if yours is missing, let me know: requests are very welcome.
What you can change
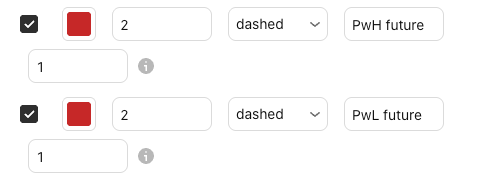
Both lines can be adjusted separately in the indicator settings (the gear icon next to Basics on your chart), under Futures levels.
| Show / hide | PwH future and PwL future checkboxes · Futures levels |
|---|---|
| Colour, width, style | Any colour · width 1–5 · solid, dashed or dotted |
| Label text | Default PwH future and PwL future |
| Lookback | 1–20 weeks (default 1: last week only); weeks older than about four weeks are not drawn |
| Back-adjusted version | PwH future b-adj and PwL future b-adj, off by default · Futures levels |
| Week boundaries | Thin vertical line where each trading week begins, on by default · Backgrounds |
| Label size, line end, visibility range | Shared with all lines · General |
Charts and defaults on this page: Basics v11.72.8 · updated 21 October 2026.
Frequently asked questions
What period does the previous week high and low of a future cover?
The full futures week: for US index futures from Sunday 18:00 New York time until Friday 17:00, for the DAX future from Monday 02:15 Berlin time (01:15 in winter) until Friday 22:00. Pre-market, regular trading hours and after-hours are all included.
Why is the future's weekly high higher than the index's weekly high?
Because the future trades much longer than the stock market, and at a different price level. See PwH / PwL future or PwH / PwL index.
Which weekly high and low does Basics use on a micro such as MES?
Those of the main future — for example ES on MES, or FDAX on FDXS. A micro has its own, thinner order book, so its own high or low can differ from the main future's — for example through a short spike. With the main future's levels you trade the same levels as traders on the big contract.
Does it work on a CFD?
Yes. On a CFD — for example US500 or UK100 — Basics converts the future's weekly high and low with the current cash-future difference, so the lines sit at the right place on the CFD chart.
Related levels
See PwH / PwL future on your own chart
Basics is free on TradingView. Add it to any supported chart — for example ES or a micro such as FDXS — and last week's high and low of the main future appear without any setup.