Untested close index: the closing prices the market never went back to
Every trading day the index has an official closing price. Yesterday's is PsC index in Basics. But older closes matter too — as long as price has not traded back to them since. Untested Levels draws exactly those: the closing prices of earlier days that are still untested. When price finally reaches one, the line turns grey for the rest of the day, and the next day it is gone. The lines appear on every supported chart: on the index and CFDs as they are, on futures converted with the cash-future difference.
On this page
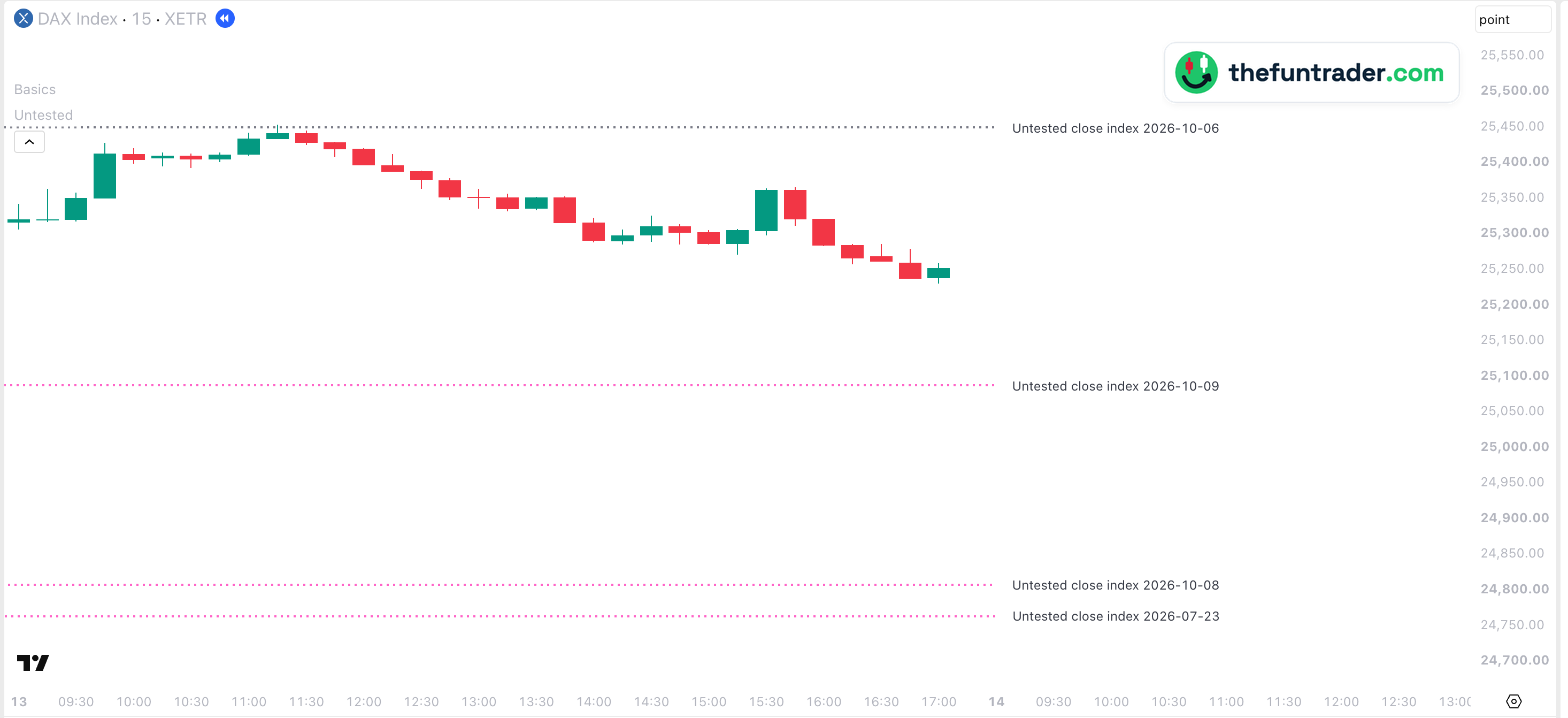 123


- 111:15 — the DAX climbs to 25,453.29, four points above the closing price of Tuesday 6 October (25,449.19). That close had been untested for a week; now it is tested, and its line turns grey for the rest of the day.
- 217:00 — the low of the day: 25,229.98, 219 points under the close of 6 October.
- 3Below the market: three closes that are still untested — 9 October, 8 October and 23 July.
Part of Untested Levels
Free TradingView indicator that marks earlier closes, opens and gaps the market has not traded back to — on index, futures and CFD charts.
Install Untested Levels (free) →Part of Straydog Zones & Levels
TradingView indicator that draws the daily DAX zones and levels from Straydogtrading.com on index, CFD and futures charts.
Install Straydog →What an untested close is
A closing price is tested as soon as price trades back to it — touches it or moves through it. Many closes are tested within a few days. Some are not: the market gapped away from them and never came back. Those are the untested closes.
Untested Levels keeps a list of them, from the most recent back to years ago, and draws the ones near the current price. Yesterday's close is left out by default, because Basics already draws it as PsC index; the two indicators are made to run together.
Why traders watch them
- Unfinished business. A close the market never returned to marks a price where it once agreed on the value of the day. Many traders expect price to come back to it, and it often acts as a magnet.
- The first touch counts. When price finally reaches an untested close, the first test is often a turning point — as in the example above.
- Grey means done. After the first touch the line turns grey for the rest of the day, so you see that the level was reached; the next day it is gone.
How Untested Levels shows them
The closes are the official closing prices of the index. They appear on every supported chart: on the index and CFDs as they are, on futures (main, mini, micro, nano) converted with the current cash-future difference.
| Default look | Pink, dotted, width 2 · tested today: grey, dotted |
|---|---|
| Labels on the chart | Untested close index and the date of the close (renamable; the price can be added) |
| Switched on by default | Yes — yesterday's close left out, because Basics draws it |
| How far back | Up to 1000 trading days (adjustable) |
| Which lines are drawn | The untested closes within 25 % of the current price (adjustable) |
| Price on your chart | Futures (main, mini, micro, nano): converted with the current cash-future difference. CFD and index charts: the index value itself |
| Timeframes | Charts from 1 second up to the daily chart; nothing on weekly and monthly charts |
| Markets | Nasdaq-100, S&P 500, Dow, Russell 2000, DAX, FTSE 100 and AEX — all tickers |
Why don't I see the lines?
- It has been tested.Once price trades back to a close, the line turns grey for the rest of that day and is gone the next day.
- It is yesterday's close.That one is hidden by default because Basics draws it as PsC index. Switch off Hide PsC to show it here as well.
- Price is far away from them.Only closes within 25 % of the current price are drawn. You can change this under General → Level visibility range.
- You are on a weekly or monthly chart.Untested Levels draws on charts from 1 second up to the daily chart.
- Your ticker is not recognised.See the supported tickers — and if yours is missing, let me know: requests are very welcome.
What you can change
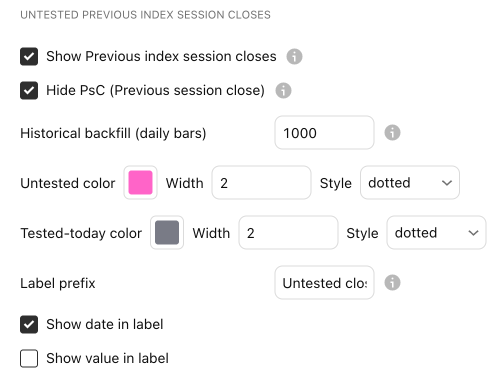
In the indicator settings (the gear icon next to Untested Levels on your chart), under Untested previous index session closes:
| Show / hide | Show Previous index session closes |
|---|---|
| Yesterday's close | Hide PsC — on by default, because Basics draws it |
| How far back | Historical backfill, default 1000 trading days |
| Colour, width, style | Separately for untested and for tested today |
| Label | Prefix (default Untested close index), with the date (on) and the price (off) |
| Label size, line end, visibility range | Shared with all elements · General |
Charts and defaults on this page: Untested Levels v2.41.9 · updated 21 October 2026.
Frequently asked questions
What does untested mean?
That price has not traded back to the level since it was made. As soon as it does, the level is tested.
Why don't I see yesterday's close?
Basics draws it as PsC index, so Untested Levels hides it by default. Switch off Hide PsC if you run Untested Levels without Basics.
Why does a line turn grey?
Price reached it today. The grey line shows for the rest of the day that the level was tested; the next day it is gone.
How far back does it look?
Up to 1000 trading days — about four years — on every timeframe.
Does it work on a futures chart?
Yes. The closes are the index's closing prices, converted to the future's price with the current cash-future difference.
Related levels
See the untested closes on your own chart
Untested Levels is free on TradingView. Add it next to Basics on any supported chart — for example the DAX or ES — and the untested closes appear by themselves.