PMKT M: the middle of the pre-market range
PMKT M stands for pre-market mid: the exact middle between the pre-market high and the pre-market low of the main future, for example NQ or YM. The pre-market is the futures trading before the stock market opens, and its range is built overnight. When that range is wide, its middle becomes a level of its own: during regular trading hours price often comes back to it, and turns there or uses it as a stepping stone. Basics draws it as a grey dashed line inside the pre-market zone. On mini, micro and nano futures it uses the main future's range, not the smaller contract's own, which can differ through a spike; on CFDs the main future's range, placed at the CFD's price. This page explains what the line shows, when it matters most and how to adjust it.
On this page
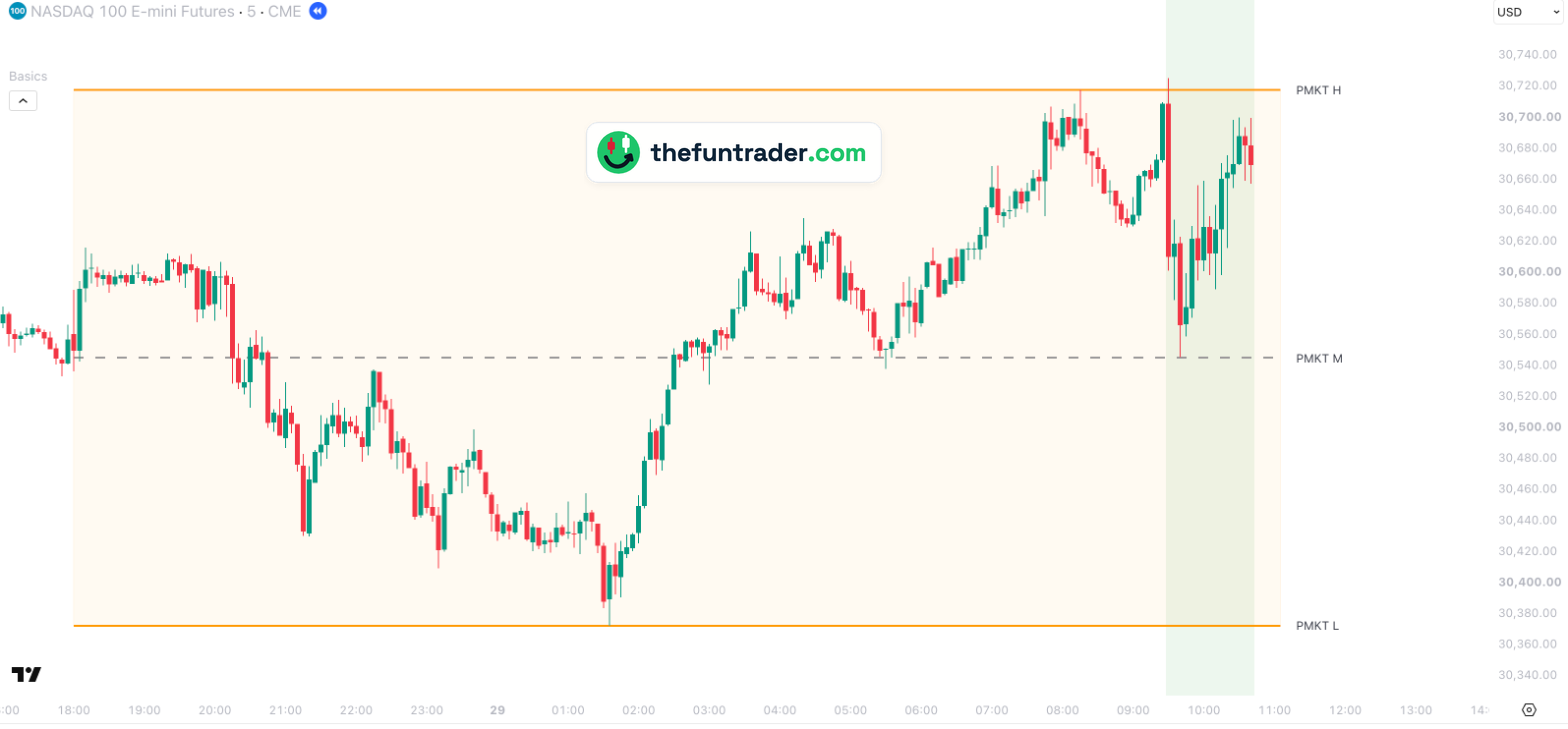 18:00 · pre-market starts09:30 · stock market opens
1234

- 1Monday 18:00 — the pre-market starts. At 01:35 NQ sets the pre-market low: 30,372.25.
- 2Tuesday 08:15 — the pre-market high: 30,717.75. The range is 345 points wide, so its middle lies at 30,545, far from both edges.
- 309:30–09:40 — at the open NQ spikes just above the pre-market high and falls back 180 points in ten minutes, to 30,545.50 — half a point above the middle.
- 409:40–10:30 — the middle holds: NQ climbs 155 points to 30,700.
Part of Basics
Free TradingView indicator with all session, week and month levels for index, futures and CFD charts.
Install Basics (free) →What PMKT M is
The pre-market range is the high and low of the future between the start of its trading day and the stock market open: 18:00 New York time the evening before until 09:30 for US index futures such as NQ, 02:15 Berlin time (01:15 in winter) until 09:00 for FDAX. PMKT M is the middle of that range:
| Formula | (pre-market high + pre-market low) ÷ 2 |
|---|---|
| On 29 September (NQ) | (30,717.75 + 30,372.25) ÷ 2 = 30,545 |
Like the high and low, the middle moves while the pre-market is still running and is fixed from the stock market open.
Why the middle matters
The pre-market range shows where the futures market traded overnight. Its middle is the balance point of that range: above it the overnight buyers had the upper hand, below it the sellers. When price returns to it during regular trading hours, many traders see it as the place where the overnight balance is tested again — so it often acts as support or resistance, or as a stop on the way to the other edge.
- A wide range makes the middle count. In a wide range the middle is far from the high and the low, so a move to it is a real move and a reaction there is visible. In the examples on this page the ranges were 336 to 462 points (NQ and YM).
- A narrow range makes it noise. When the pre-market barely moved, the middle lies just a few points from both edges and adds little of its own.
- The overnight doesn't count. During the pre-market price naturally crosses its own middle many times. What matters is the reaction after the open, when the volume arrives.
The high and the low of the same range are explained on the PMKT H / PMKT L page.
How Basics shows it
Like the range itself, PMKT M appears on every supported chart — futures (main, mini, micro, nano), CFDs and the index — each time at the right price for that chart.
| Default look | Grey, dashed, width 2 — inside the orange pre-market zone |
|---|---|
| Label on the chart | PMKT M (renamable) |
| Switched on by default | Yes |
| Value | The middle of the pre-market high and low |
| Where the line starts | At the start of the pre-market (18:00 New York, 02:15 Berlin, 22:00 London, 08:00 Amsterdam); on an index chart at the first candle of regular trading hours |
| Timeframes | Charts from 1 minute up to the daily chart, on seconds charts too, unless the level needs more history than the chart loads; not on weekly or monthly charts |
| Markets | Nasdaq-100, S&P 500, Dow, Russell 2000, DAX, FTSE 100 and AEX — all tickers and pre-market times |
| Price on your chart | Main future: its own range. Mini, micro and nano: the main future's range. CFD: the main future's range, placed at the CFD's price. Index chart: the main future's range, converted to the index price |
| Lookback | 1 — today's pre-market only (up to 20 sessions, set in the indicator settings) |
Tip: switch on Backgrounds → RTH session to shade the regular trading hours, as in the charts on this page. Then you see at a glance which touches of the middle happen after the open — the ones that count.
More examples
Click a chart to enlarge it.


Why don't I see the line?
- You are on an index chart before the open.An index is not calculated in the pre-market, so on an index chart the line appears from the first candle of regular trading hours.
- You are on a weekly or monthly chart, or a seconds chart.The line is drawn on charts from 1 minute up to the daily chart. On a seconds chart, a level that needs more history than the chart loads is hidden.
- It is switched off.Check the PMKT M box and the master switch Show all objects in 'Session levels' group in the indicator settings.
- Your ticker is not recognised.See the supported tickers — and if yours is missing, let me know: requests are very welcome.
What you can change
The line can be adjusted in the indicator settings (the gear icon next to Basics on your chart), under Session levels.
| Show / hide | PMKT M checkbox · Session levels |
|---|---|
| Colour, width, style | Any colour · width 1–5 · solid, dashed or dotted |
| Label text | Default PMKT M |
| Lookback | 1–20 sessions (default 1: today only) |
| Label size, line end | Shared with all lines · General |

Charts and defaults on this page: Basics v11.72.8 · updated 21 October 2026.
Frequently asked questions
What is the pre-market midpoint?
The exact middle of the pre-market range: the pre-market high plus the pre-market low, divided by two.
When does the pre-market midpoint matter most?
When the pre-market range is wide. Then the middle is far enough from the edges to be a level of its own, and price often returns to it or reacts to it during regular trading hours. See why the middle matters.
Does PMKT M work on MNQ, MES or a CFD?
Yes. On mini, micro and nano futures Basics uses the main future's pre-market range, not the smaller contract's own, which can differ through a spike. On a CFD it uses the main future's range, placed at the CFD's price.
Related levels
See PMKT M on your own chart
Basics is free on TradingView. Add it to any supported chart — for example NQ or MYM — and the pre-market range and its middle appear without any setup.