Untested open CFD: the price at the open that price never went back to
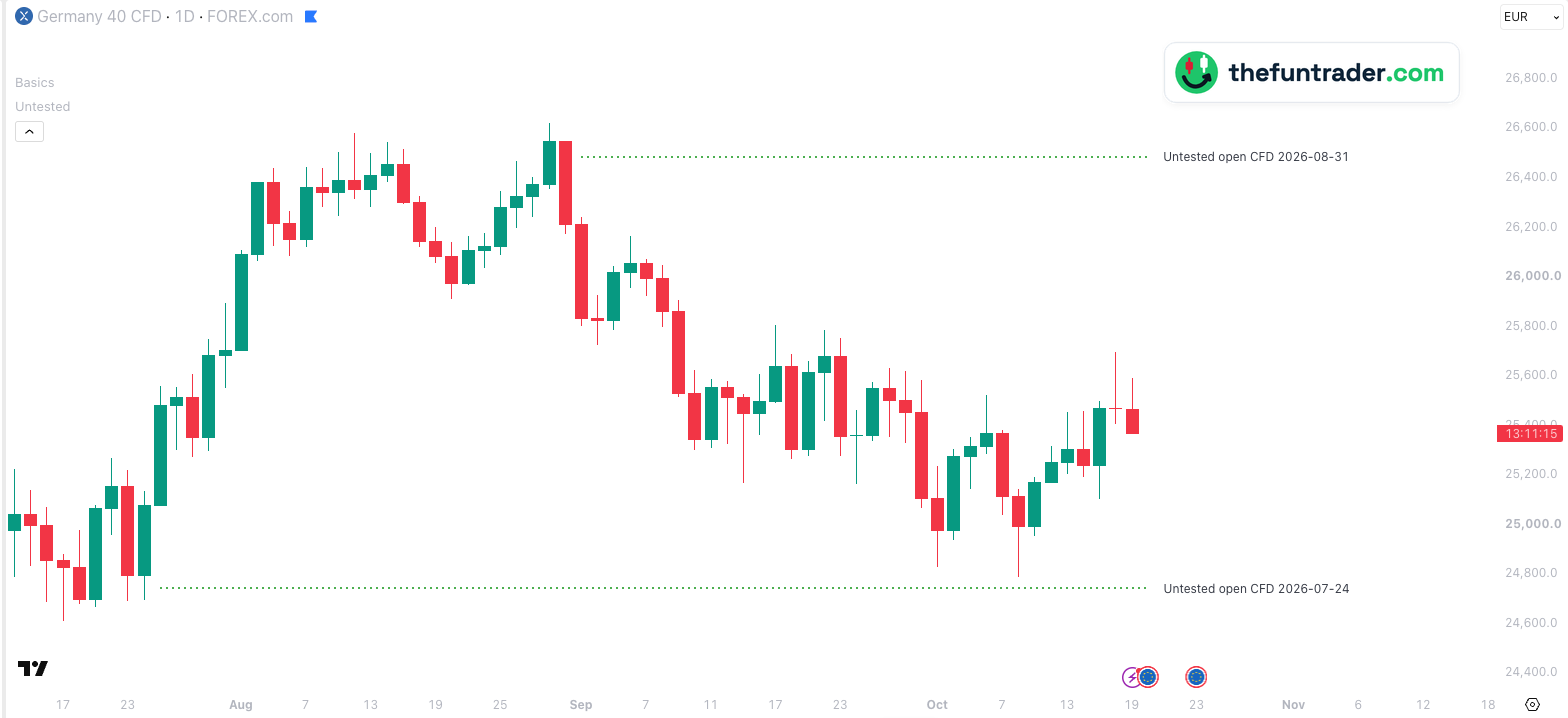
When the stock market opens, a CFD that follows the index already has a price — the market's price at that exact moment. The official index opening price comes a little later and can be quite different on a fast open. Untested Levels keeps the CFD's price at the open of earlier days on your chart as long as the index has not traded at it again. The lines appear on every supported chart: on the index and CFDs as they are, on futures converted with the cash-future difference.
On this page
 123

- 124 July — at 09:00 GER40 trades at 24,742.5. Two minutes later it is 94 points higher; the DAX itself never trades that low all day.
- 231 August — at 09:00 GER40 trades at 26,485.0. The official DAX opening price is 26,464.14 and the DAX never gets higher than 26,471.79 that day.
- 319 October — both prices are still untested. The closest the DAX came: 50 points above the lower one, on 8 October.
Part of Untested Levels
Free TradingView indicator that marks earlier closes, opens and gaps the market has not traded back to — on index, futures and CFD charts.
Install Untested Levels (free) →What an untested CFD opening price is
At the moment regular trading hours start — 09:00 on the DAX, 09:30 in New York — a CFD that follows the index is already trading. Its price at that moment is where the market stood when the stock market opened. On most days the index is back at that price within minutes. On some days it isn't: the market jumps away at the open and does not come back. That price is then an untested open CFD.
It differs from the official index opening price. That one is calculated from the first trades of the stocks in the index and arrives a little later. On a quiet open the two are close; on a fast open they can be far apart — on 24 July 2026 almost 90 points, see below.
Why traders watch them
- A jump at the open. An untested CFD opening price marks a day the market moved away from the open at once and never looked back. The price it left behind is a level many traders keep in mind.
- The first return. When price finally comes back to it, the first test is a moment to watch.
- Grey means done. After the first touch the line turns grey for the rest of that day; the next day it is gone.
How Untested Levels shows them
On a CFD chart the price is that CFD's own price at the open; on index and futures charts it is taken from a CFD that follows the index, and on futures (main, mini, micro, nano) converted with the current cash-future difference. Whether it is tested is decided by the index itself during regular trading hours — moves of the CFD in the evening or at night do not count. Today's price at the open is left out by default, because Basics already draws it as RTH O.
| Default look | Green, dotted, width 2 · tested today: grey, dotted |
|---|---|
| Labels on the chart | Untested open CFD and the date (renamable; the price can be added) |
| Switched on by default | Yes — today's price at the open left out, because Basics draws it |
| How far back | About three months |
| Which lines are drawn | The untested prices within 25 % of the current price (adjustable) |
| Timeframes | Charts from 1 second up to the daily chart; nothing on weekly and monthly charts |
| Markets | Nasdaq-100, S&P 500, Dow, Russell 2000, DAX, FTSE 100 and AEX — all tickers |
The open of 24 July, minute by minute
Click the chart to enlarge it.

Why don't I see the lines?
- There is none nearby.Most days the index is back at the CFD's opening price within minutes; only a jump at the open leaves one untested.
- It has been tested.Once the index reaches it again, the line turns grey for the rest of that day and is gone the next day.
- It is older than about three months.Untested open CFD looks back about three months.
- It is today's price at the open.That one is hidden by default because Basics draws it as RTH O. Switch off Hide RTH O to show it here as well.
- Price is far away from them.Only prices within 25 % of the current price are drawn. You can change this under General → Level visibility range.
- Your ticker is not recognised.See the supported tickers — and if yours is missing, let me know: requests are very welcome.
What you can change
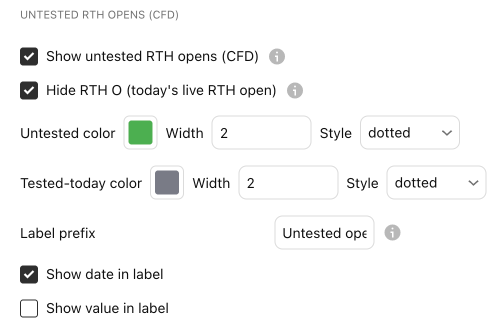
In the indicator settings (the gear icon next to Untested Levels on your chart), under Untested RTH opens (CFD):
| Show / hide | Show untested RTH opens (CFD) |
|---|---|
| Today's price at the open | Hide RTH O — on by default, because Basics draws it |
| Colour, width, style | Separately for untested and for tested today |
| Label | Prefix (default Untested open CFD), with the date (on) and the price (off) |
| Label size, line end, visibility range | Shared with all elements · General |
Charts and defaults on this page: Untested Levels v2.41.9 · updated 21 October 2026.
Frequently asked questions
What is the difference with Untested open index?
Untested open index uses the official opening price of the index, which is calculated from the first trades of its stocks. Untested open CFD uses where the market stood at the exact moment the stock market opened. On a fast open they can be far apart.
Why does a CFD candle cross the line without testing it?
Only the index during regular trading hours counts. A CFD also trades in the evening and at night; those moves do not test the level.
How far back does it look?
About three months, on every timeframe.
Why don't I see today's price at the open?
Basics draws it as RTH O, so Untested Levels hides it by default. Switch off Hide RTH O if you run Untested Levels without Basics.
Does it work on a futures chart?
Yes. The price is converted to the future's price with the current cash-future difference.
Related levels
See the untested CFD opens on your own chart
Untested Levels is free on TradingView. Add it next to Basics on any supported chart — for example the DAX, GER40 or ES — and the untested prices at the open appear by themselves.